How to Read Your Dashboard Analytics
You’ve probably finished setting up your Custom Domain, created your first campaigns, and added your dropship listings. First of all, congrats and welcome! Second of all, don’t forget to keep track of your sales performance since day one.
Our Analytics dashboard helps you identify where your customers are coming from, what products are appealing to them, and which upsells and coupons are more successful in your store. So, without further ado, let’s dive in.
Where to Find The Data
Analytics are displayed inside the details of listings and campaigns or in your main dashboard. Follow these steps to access the data:
Print-On-Demand Analytics
There are two primary sources of information for your POD performance:
Main Dashboard
Log into your account and click on the POD tab. Here you’ll find the main dashboard, which shows your all-time performance for print-on-demand campaigns. Filter by domain and date to get a chart with your sales record, views, orders, unit sales, and total profits.
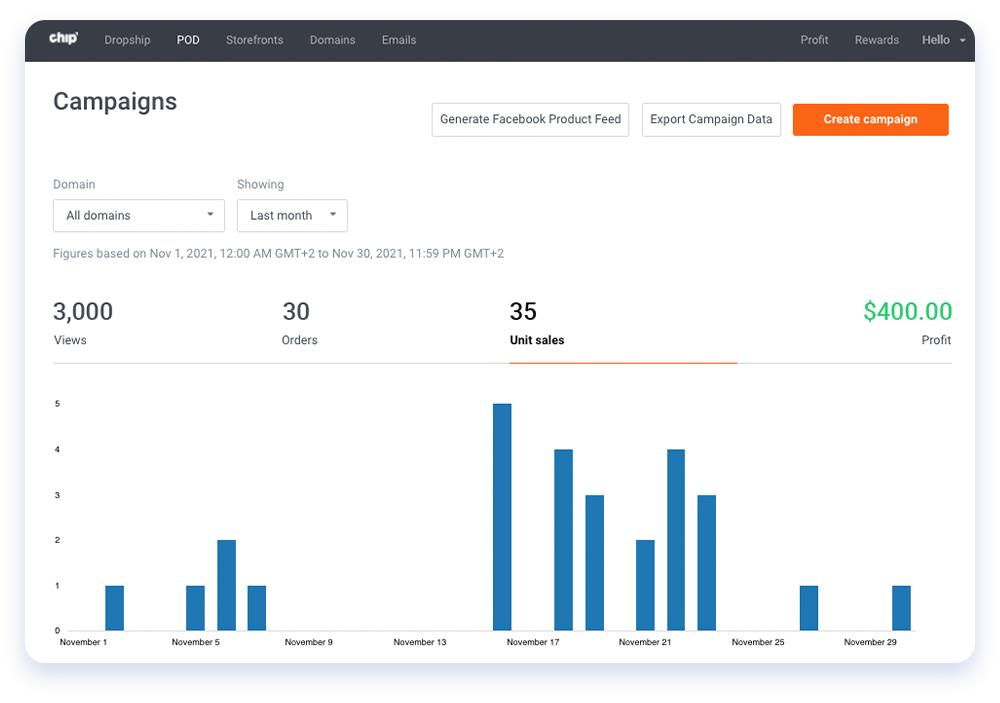
You can also get a CSV report with views, number of orders, conversion rate, unit sales, total profit, and campaign statuses by exporting your campaign data. Just type in your email, select the time range you want to check on, and you’ll receive it in your email within 24 to 48 hours.
Campaign Analytics
You can also track and review campaigns individually:
- Log into your seller dashboard
- Click on the POD tab
- Select the campaign you want to review
- Click on Details
Dropship Listing Analytics
All your data is concentrated inside each product listing, so here’s what you have to do:
- Log into your seller dashboard
- Click on the Dropship tab
- Select the product you want to review
- Go to Analytics
What Dropship and Campaign Analytics Show
Both dropship and campaign analytics sections display the same information. Once you pop in, you’ll find the following:
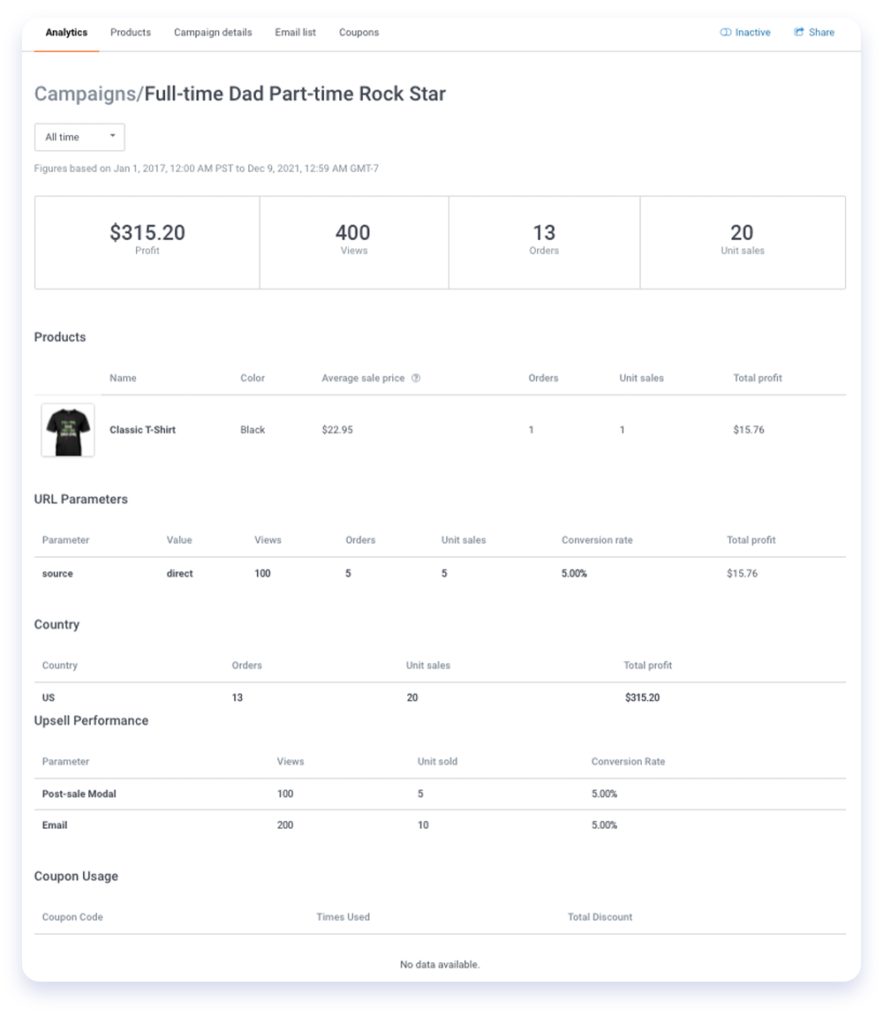
Overview
Filter the data for a specific time frame to get a record of total profits, views, orders, and unit sales of a campaign or listing.
Products
Whether you’re checking on campaign products or dropship variants, you get an average sale price for items – calculated based on the market prices, total orders, unit sales, and earned profits.
✍?Pro Tip: Check on your best-sellers! What do they have in common? What is it that makes them so successful? Take these insights, and replicate them with the rest of your catalog.
URL Parameters
An URL parameter is a way to pass information about a click through an URL. Here, you can identify your traffic sources and understand which channels are best-converting for your store.
Country
This section helps you know where your orders have been shipped to and the total profits you’ve gotten from these customers.
Upsell Performance
Just as its title states, find a list of your enabled upsells and check how many views, units sold, and conversion rate you have for each, then decide which ones to keep or optimize.
Coupon Usage
Keep track of how many times your customers have applied your coupons and the total discount you’ve given to them.
How to Use This Information
What gets measured gets managed! This data is very insightful when planning your marketing strategy, as you’ll be able to:
- Learn from successful campaigns – As you check on your best-selling products or artwork, you’ll start to identify what’s more appealing to your audience. Explore various niches, design styles, and product categories to offer more of what they’re looking for!
- Create high-converting promotions – Test different upsells and coupons, check on their results to see which ones drive more sales, and stick to those that work best for your customers.
- Make price adjustments – Whether you want to increase or drop your prices, review your profit margins for each product to see what changes can be made.
- Understand your buyer’s behavior – Analyze where they’re from, which traffic sources are driving them to your store, and what’s their average spend. Then, take these insights to adjust or build your buyer persona, run ads on your most successful marketing channels, and come up with new products to sell.
- Identify your high-selling periods – Historical sales records are a gold mine for future strategies. So check on your sales’ peaks on previous periods to prepare ahead for the holidays or chart-topping seasons.
*Current bug fixes: When selling a product in two listings, total sales will go to one of the listings. If you’re currently facing this issue, please reach out to our team via social media or email at sellersupport@chipchip.com.