Get Started with Google Analytics for Ecommerce

What is Google Analytics?
Google Analytics provides relevant, in-depth insights about your site’s performance. We know it can be intimidating, but don’t be scared! Here’s all you need to know about getting started with Google Analytics (GA) for your Chip store.
Why is Google Analytics important?
We could give you tons of reasons, but we’ve wrapped it up to three:
- To understand your audience – Knowing how your visitors behave in your store will help you make the right decisions to optimize it. GA lets you know:
- Where your website traffic comes from
- What people do once they arrive at your website
- How visitors turn into buyers
- It's free – You read that right! It charges no fees. Once you’ve added the tracking code to your Chip store, it will automatically start tracking your data.
- To take advantage of other advertising products – You can keep growing your store by integrating Analytics with other Google products.
How to set up Google Analytics in your Chip store
It is easier than you think. Log in or create your account, and locate your Tracking ID:
- Go to the Admin tab at the bottom left corner of your GA dashboard.
- Make sure you’ve selected the correct account and property and click on Tracking Info.
- You should be able to see the Tracking Code now.
- Go to your Custom Domain settings.
- Scroll down to Conversion Tracking and paste your ID under the Google Analytics box.
Remember: This code is unique to your website; avoid sharing it with anyone publicly.
Test your Tracking ID
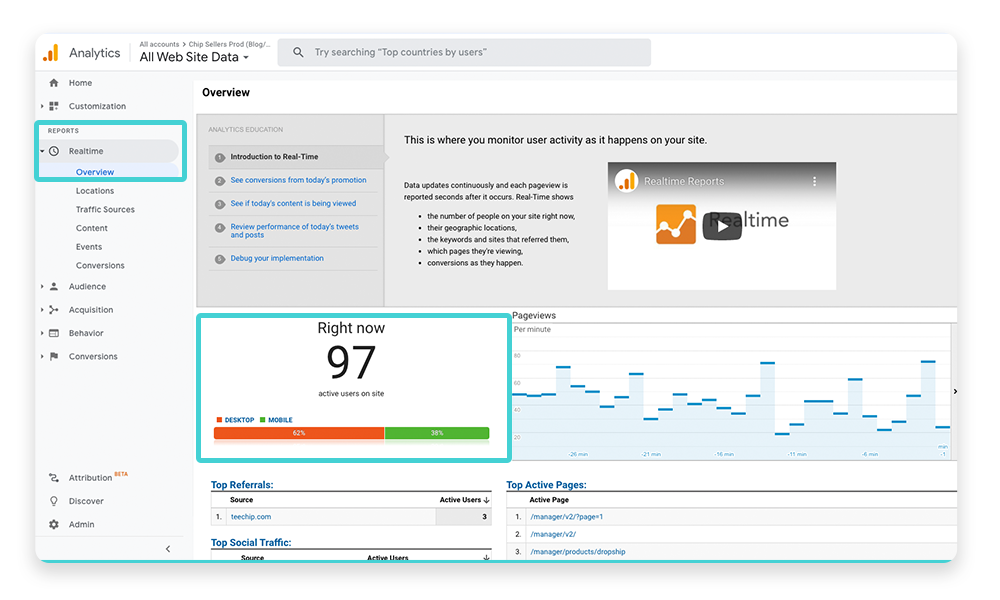
Make sure your code is working: Open your store in a different browser or use an incognito mode window. At the same time, in Google Analytics, go to Realtime > Overview.
If it has been installed correctly, you should see something like this:
Google Analytics Goals, explained
A goal represents a completed activity that contributes to the success of your store - in this case, purchases. They help you measure how well your website fulfills your target objectives. Without this information, it’s hard to evaluate the effectiveness of your site!
Goals are configured at view level and are applied to specific pages or screens your users visit. Each one can have a monetary value, so you can track how much that conversion is worth to your business. There are four types:
| Goal Type | Description + Example |
|---|---|
| Destination | A specific location loadsExample: A listing/campaign page |
| Duration | Sessions that last a specific amount of time Example: 10 minutes or longer spent on your store |
| Pages/Screens per session | A user views a specific number of pages or screensExample: 5 campaigns pages have been loaded |
| Event | An action defined as an Event is triggered. Example: A buyer clicks on your listing ad |
When a visitor to your store performs a goal, Analytics records this data as a conversion and makes it available to you in reports.
Reports overview
Once you’ve set up your goals, you can access five report categories to keep track of them. These are on the left panel of your dashboard and indicate the following:
- Realtime – As its name suggests, it displays data of users exploring your store and consuming content right now.
- Audience – Learn more about your visitor behavior by checking how many users and sessions your site has had, how many pages users have visited, and reviewing demographic insights about your niche.
- Acquisition – A detailed report that informs you where the users on your site come from, paid and organically.
- Behavior – Shares in-depth behavior insights like page views, session duration, and bounce rate. These elements let you know which pages catch your customers’ attention the most and are very useful when looking for new products to sell.
- Conversions – Gives you an idea of how your visitors are converting, or in this case, purchasing on your store.
Select the date range you want to analyze, and have fun with all the dimensions and metrics you’ll find!
Understanding Dimensions and Google Analytics Metrics
These two elements are the backbone of GA. All Google Analytics’ reports are based on these two elements:
- Dimensions = The attributes of your data
- Metrics = The quantitative measure of dimensions
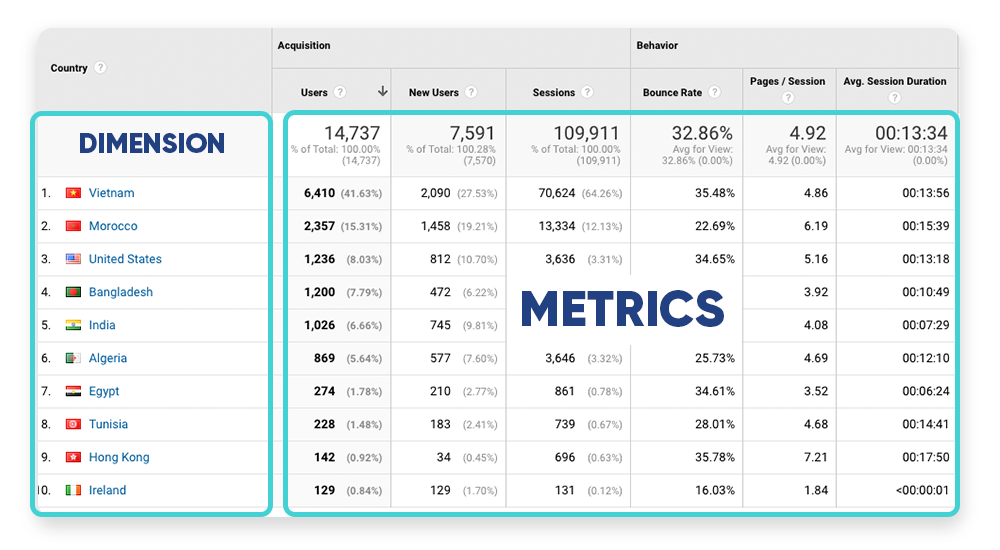
For example, the dimension “Country” indicates the place from which a session originates. And the metric “Users” represents the total number of users who have initiated a session in that specific location at a specific time.
Best Google Analytics metrics for ecommerce
All stores are different, and the metrics for each ecommerce business may vary depending on your goals. However, we recommend constantly checking on these three:
Users
Keep an eye on your audience growth by checking how many visitors your store gets. Users can be divided into “New” and “Returning”: New users are people who are visiting your website for the first time, and returning users are customers who have decided to come back to your store.
Comparing these two gives you an overview of your customer retention and how many new visitors have become recurrent clients.
- Where to find it? Click on Audience > Overview on your GA dashboard.
Conversion Rate
This valuable metric indicates the percentage of visitors who buy something from your shop. It can help you size the success of all your traffic sources to find out which one is top-performing. For example, you can compare your Facebook and Instagram ads to see what channel gives you more sales.
- Where to find it? Conversions > Ecommerce at the left panel of your dashboard.
Bounce Rate
This percentage shows how many users who land on your site leave after visiting a single page. It is calculated by dividing single-page sessions between all sessions, and the lower it is, the better!
We can say that a good bounce rate is between 20% and 45% percent. But, of course, it can depend on how your store is arranged.
- Where to find it? Under Acquisition > Overview or Behavior > Overview on Google Analytics.
Other metrics to keep in mind
Take your time to explore all metrics Google Analytics offers and decide which ones work better for your store. Here are more suggestions you can consider:
- Traffic sources
- Active Visitors
- Top Pages
- Average pages per visit
- Average visitor duration
Best practices using Google Analytics for ecommerce
Make the most out of your Google Analytics account!
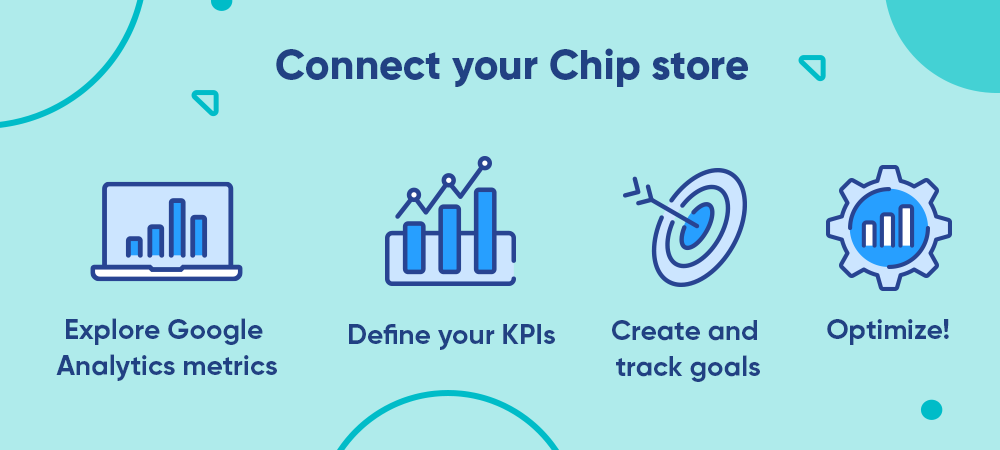
Connect Google Analytics to your Chip account > Explore GA metrics > Define your KPIs > Create and track goals > Optimize!
Define and track your KPIs
Key Performance Indicators (KPIs) allow you to track the performance of your store over time. According to your current performance, define your business objectives and create an action plan to achieve them. Use goals and ecommerce tracking to trace your conversions.
Filter and customize your data
Access all your data easily by creating custom dashboards and reports:
- To create a new dashboard: Go to your menu panel on the left side, then click on Customization > Dashboard > Create > Select a Blank Canvas or a Started Dashboard > Add all the widgets you want to include > Save it.
- To create a new custom report: Click on Customization > Custom Reports > New Custom Reports > Set your parameters > Save it.
You can share them on a weekly, monthly, or custom-date range basis. Select the dashboard or report > click on share and fill out the information and frequency. Voilà! Receive them in your email and keep track of your performance easily.
Keep optimizing
Make your store grow! Use the valuable information Google Analytics hands you, and learn to identify opportunities or improvement areas to take your Chip store to the next level.
Got any questions? Share them on our Facebook Community Group or via email at sellersupport@chipchip.com.